Simulation of CTX Plasmas
Introduction
Measurements made in the CTX device are compared to numerical simulations.
A self-consistent nonlinear simulaiton of a plasma trapped in a magnetic dipole has been written to simulate the evolution of electron and ion dynamics in the presence of a hot population of deeply trapped electrons created by electron cyclotron resonance heating (ECRH). This simulation has reproduced the frequency-sweeping phenomena associated with the hot electron interchange (HEI) instability.
The current simulation utilizes some modern advancements in scientific computing: namely the PETSc package for distributed computation, FFTW, and HDF5 for data output. These new tools make possible the simulation of plasma interchange modes on a much more refined scale in reasonable CPU hours. With higher grid resolution, the turbulence associated with interchange modes in the magnetic dipole geometry can be investigated from a purely computational perspective, and compared to observations.
The HEI Simulations
A sequential, explicit time-stepping code was developed in FORTRAN which reproduced the observations of the HEI instability in CTX.
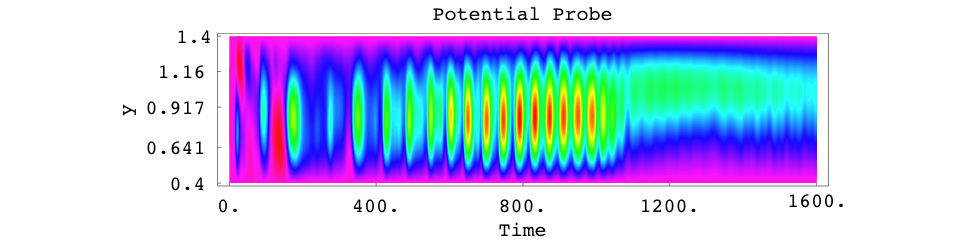
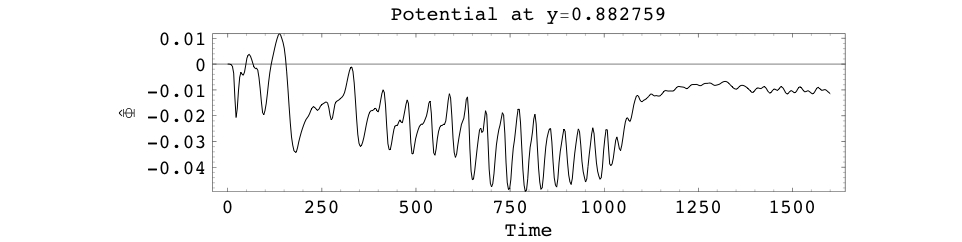
The time evolution of the potential displayed the frequency sweepeing associated with the instability, and the mode structure agreed well with observations.
Potential
The sequential simulation also included &mu-diffusion which suppresses the HEI (see publications and thesis by D.Maslovsky), as well as plasma rotation.
The New Simulations
The new simulations have been developed (B.A.Grierson) in C using the PETSc libraries for handling distributed arrays. In order to scale, a Fast Poisson Solver using a parallel tridiagonal solver had to be developed, and is currently being refined.
The solver is begin developed in collaboration with Argonne National Laboratory's MCS division, and uses the Parallel Partition Algorithm for a general tridiagonal system. No assumptions are made about symmetry or diagonal dominance.
The computation domain is decomposed into 'horizontal bands' without breaking the periodic 'x' direction across processes.
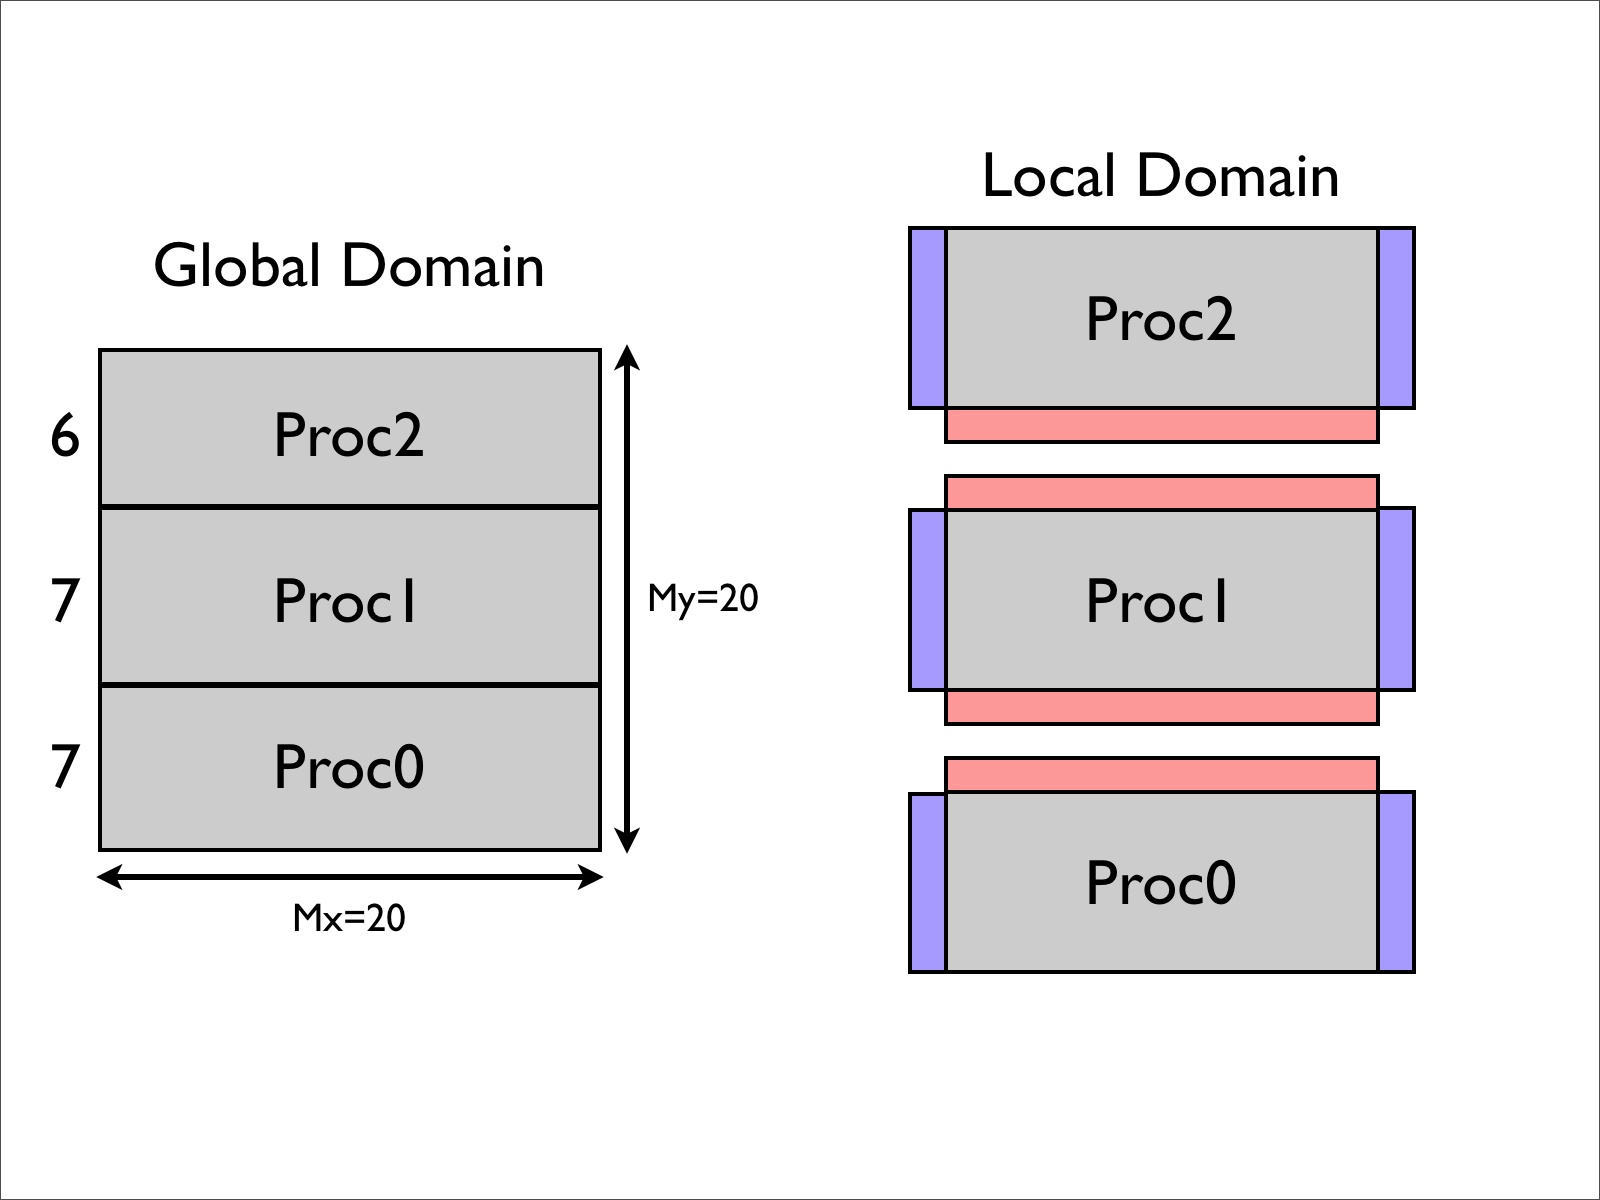
The solver strong scales well up to 12 processors for a 2000x2000 structured grid, inverting Poisson's Equation.
The graphic includes plots of previous, un-optimized versions of the solver, as well as the 'ScatterToZero' method, which doesn't scale.
The full simulation scales well up to 12 processors for grids larger than 100x100
Some graphics and movies from the more refined simulations are given below.
Right-click and download Movie (.flc) of ion density for a 100x100 structured grid. The turbulent eddies are easily seen (will play in QuickTime).
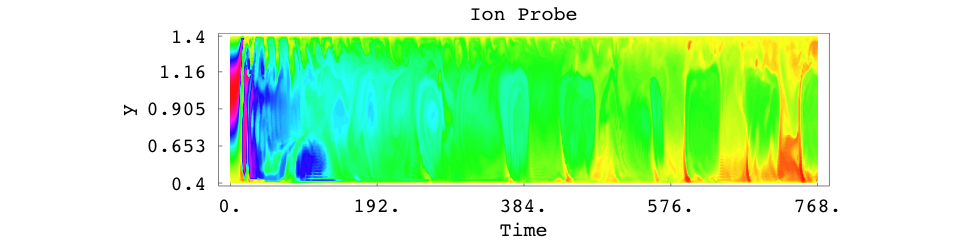
Radial Ion density in time
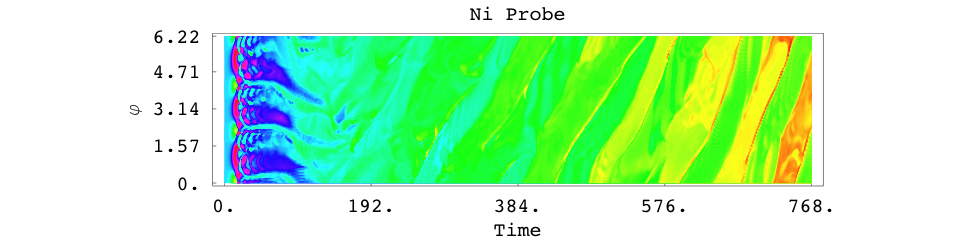
Azimuthal Ion density in time
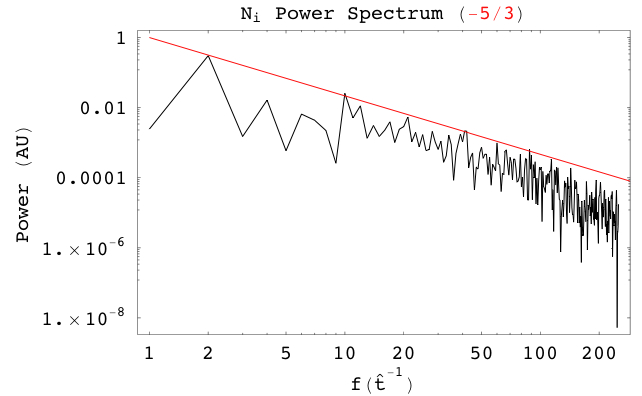
The power-law like frequency spectrum
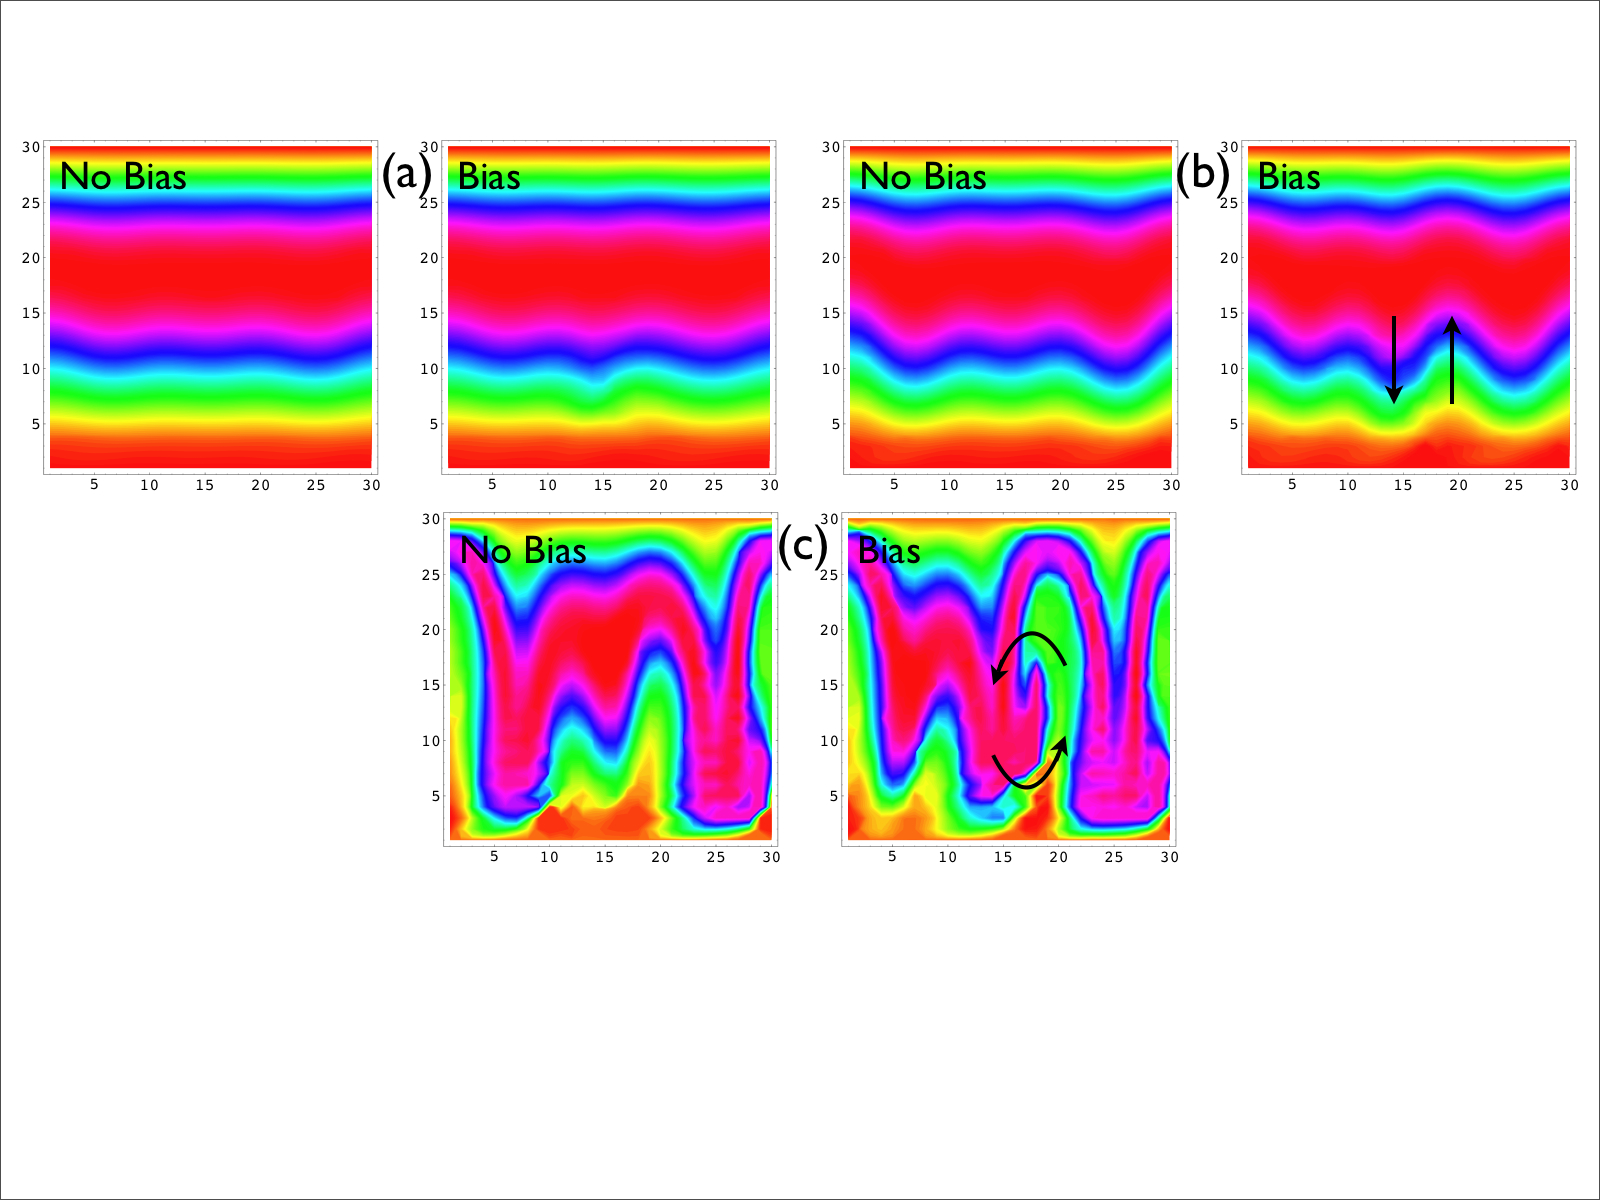
Bias Probe
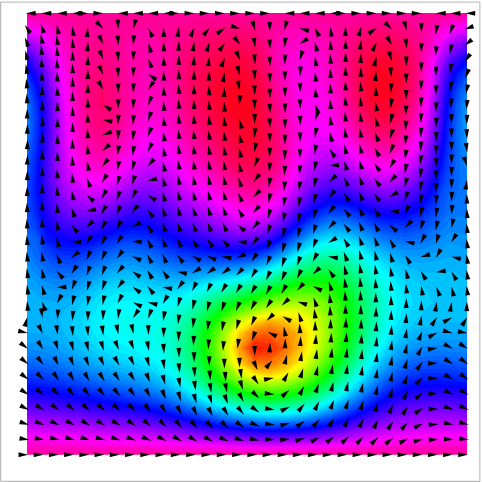
The new simulations also include 'probes' for biasing the plasma, driving ExB vortices and plasma mixing.
When the bias is 'triggered' during an instability, the probe drives mixing which breaks the wave-particle resonance and destroys the evolution of the instability.
Onset of instability in the presence of point-voltage source static bias.
The radial potential
 and individual trace
 .
.
An image of the ExB flow pattern in the plasma with a Bias Probe.
Useful Links For Simulation Science
Organizations
SciDAC: DOE Scientific Discovery through Advanced Computing.TOPS: Terascale Optimal PDE Simulations (Towards Optimal Petascale Simulations??), a SciDAC project.
Numerical Software Libraries
PETSc: The Portable, Extensible Toolkit for Scientific computation. Distributed arrays, linear and nonlinear solvers. Can interface with MANY different libraries, such as ScaLAPACK, FFTW, hypre, SuperLU(_Dist), and othersFFTW: The Fastest Fourier Transform in the West.
HDF5: Hierarchical Data Format (5) for sequential or parallel data output. See below for example code.
Visualization Software
While I usually use IDL (or Mathematica) for reading the HDF5 files, other more sophisticated visualization analysis software is available for 3D graphics rendering of massive data sets.For the beginner, using IDL, Mathematica or MATLAB should be sufficient. All three can read HDF5, as well as make animations and .mpg movies. I prefer IDL to output PPM images, then assemble using ppm2fli producing clean, lossless graphics.
For the more advanced, you can create a PETSc ASCII viewer to create a .vtk file to use with VTK (see below).
VTK: Visualization Toolkit. A (quite massive) library for graphics rendering.
Example Diagnostic Graphic
ParaView: Parallel Visualization Application. Another Kitware software package for viewing datasets, which uses VTK. Nice GUI and mouse manipulation. Example 2D solution in a 3D environment
![]()
VisIt: From LLNL, a parallel visualization package developed under the Advanced Simulaiton and Computing Initiative (ASCI) which I haven't used yet.